Monitor application trends
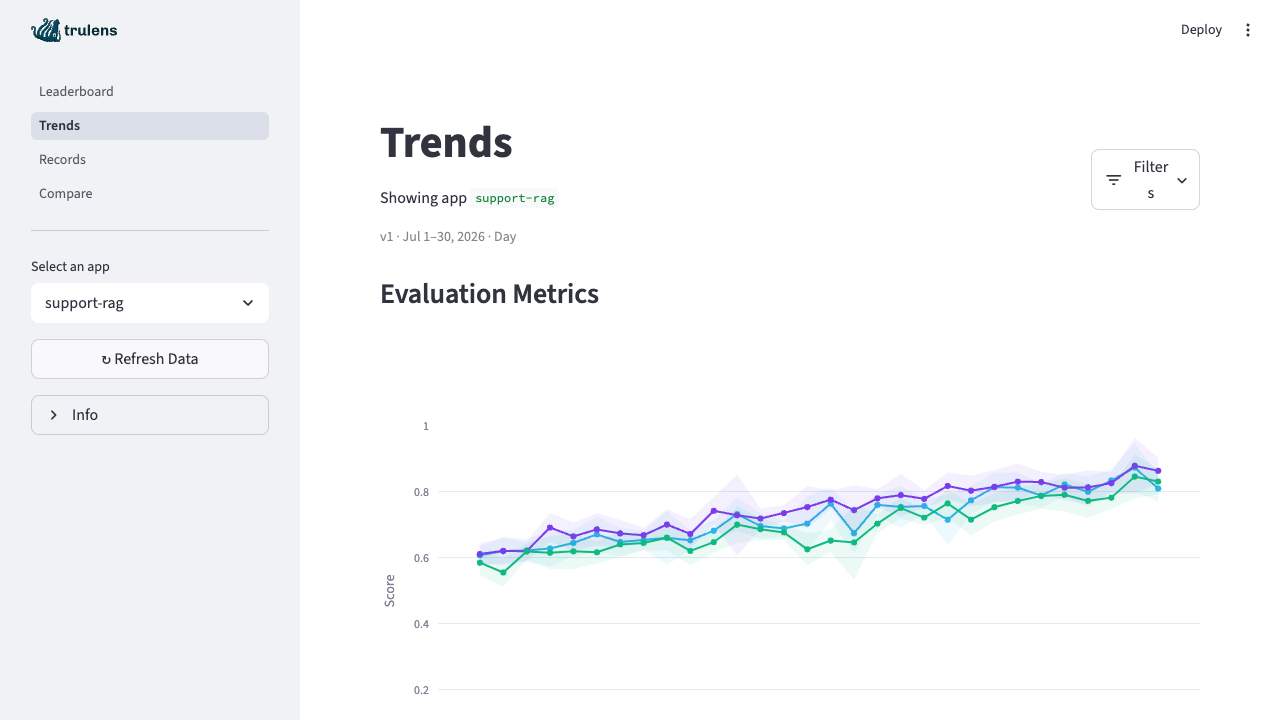
The Trends page helps you detect changes in application quality, performance, and cost over time. It combines evaluation metrics, latency, app cost, and evaluation cost in one view and lets you investigate the records behind any point or time range.
Filter trends
Select Filters in the upper-right corner to choose:
- One or more app versions. The table also shows the latest observed online evaluation sample rate for each version.
- A start and end date.
- Daily or weekly time buckets.
Trends initially selects one app version to keep charts readable. It prefers a pinned version; otherwise, it selects the version with the most recent record activity.
The active versions, date range, and bucket appear in a compact summary above the charts.
Interpret the charts
Evaluation Metrics
The Evaluation Metrics chart plots all available evaluation metrics together:
- Color identifies the metric.
- Line style identifies the app version.
- Shading shows the 95% confidence interval around the mean score.
- Hover details show the mean score and number of evaluations in the bucket.
A wider confidence interval usually indicates that a bucket contains fewer evaluations or more variable scores. Consider the observed sample rate and evaluation count before comparing changes between versions.
Latency
The Latency chart shows three statistics for each app version:
- Average latency
- P90 latency
- P99 latency
Use the upper percentiles to find slow records that an average can hide.
App Cost
App Cost measures the cost of running the application. It includes:
- Total app cost in each time bucket.
- Average app cost per record.
Cost series remain separated by currency.
Evaluation Cost
Evaluation Cost measures the cost of evaluating application records. It is shown separately from app cost and includes:
- Total evaluation cost in each time bucket.
- Average cost per evaluation.
Separating these costs helps you distinguish changes in application usage from changes in evaluation volume or sampling.
Investigate records
Every Trends chart supports record-level investigation:
- Select one or more points, or drag a box across a time range.
- Select Investigate records below the chart.
- Review the matching records on the Records page.
The investigation keeps the selected app versions, metrics, time range, and currency. Records are ordered to put the most useful examples first:
- Evaluation investigations prioritize the worst scores according to the metric's direction.
- Latency and cost investigations prioritize the highest values.
For evaluation metrics and evaluation cost, Trends uses the evaluation time when resolving records. For latency and app cost, it uses the application record time.
Investigate conversations
When a matching record has a conversation_id, the Records page loads the
complete conversation instead of showing the matching turn in isolation.
Threads are scoped to the app and app version, and they are ranked using the
worst matching turn.
The conversation view shows:
- All turns in chronological order.
- Which turns matched the investigation and which provide surrounding context.
- Conversation-level latency, app cost, and token totals.
- Evaluation metric summaries and per-turn scores.
- The complete trace for each turn.
Standalone records remain available as individual entries.
Understand sample rates
The app-version filter displays the latest sample rate observed in online evaluation decision telemetry. A lower sample rate means fewer records are evaluated, not that fewer application records are logged.
See Run feedback functions in your app for sampling, throttling, budget, and decision-reason configuration.